Preventing a COVID-19 Foreclosure Crisis
Oct 27, 2021
The pandemic has put tremendous pressure on thousands of CT homeowners, struggling to keep up with mortgage payments, property taxes, and other housing-related costs. Who has been most affected? And what resources are available to help?
Preventing a COVID-19 Foreclosure Crisis
Like most of the country, Connecticut experienced a severe economic downturn following the outbreak of COVID-19 that began in March 2020 and, in many ways, continues to impact residents well into 2021. Seemingly overnight, thousands of households had their incomes reduced due to job losses or their hours reduced as a result of having to take care of loved ones, thereby limiting their ability to pay their mortgage and other housing-related costs. In a matter of months, Connecticut saw its unemployment rate spike to levels higher than at any time during the Great Recession (approximately 2009 to 2012). As the state begins to reopen, unemployment rates remain above pre-pandemic levels. The loss of jobs in industries like tourism, food service, and hospitality has primarily and disproportionately impacted lower-income people and people of color.
The economic downturn also caused a severe housing crisis in Connecticut, resulting in rising delinquency rates and the unequal recovery from the pandemic in the housing market, especially among lower-income homeowners and in communities of color. According to the US Census Household Pulse Survey, between April 23rd and May 5th of 2020, 48,390 Connecticut homeowners had no confidence in their ability to pay their next month’s mortgage payment. As of early June 2021, that number had improved only slightly to 34,787. According to the Harvard Joint Center for Housing Studies (JCHS), 38.1 percent of homeowners in Connecticut lost employment income and 11.2 percent were behind on housing payments during the pandemic.
As federal and state foreclosure moratoria and forbearance periods end, it is expected that delinquency and foreclosure actions will recommence. According to Black Knight Inc., Connecticut’s June 2021 30 day delinquency rate is 4.9 percent with significant concentration in communities of color and low-income communities. This analysis assembles disassociated data to describe current conditions faced by Connecticut homeowners in an effort to assess the needs of homeowners across the state who have been impacted by COVID-19.
COVID-19’s Impact on Connecticut Homeowners
Prior to the outbreak of COVID-19 and the subsequent economic downturn, Connecticut’s monthly 30 day mortgage delinquency rate averaged 4.1 percent. Beginning in April 2020, the state’s delinquency rate jumped to 8.2 percent and then 9.6 percent in May (Figure 1). Delinquencies in Connecticut remained high throughout 2020 and into 2021, although they have declined significantly from their spring 2020 peak. In March 2020, Congress enacted the Coronavirus Aid, Relief, and Economic Security (CARES) Act which implemented the first foreclosure and eviction moratoria and broadly expanded the opportunity for all homeowners to access forbearance. The foreclosure moratorium was extended several times before ending on July 31, 2021.
Figure 1: Black Knight 30 Day Delinquency Rate
Source: Black Knight Mortgage Monitor Reports
The Federal Reserve Bank of Atlanta aggregates Black Knight McDash data, a loan level mortgage performance dataset from Black Knight Inc., in its Mortgage Analytics and Performance Dashboard (MAPD). This dataset comprises roughly two-thirds of the mortgage market and includes flags for delinquency and forbearance. The data is filtered for active loans for owner-occupied residences that are secured by first liens. Zip codes with under 50 active loans are excluded from the sample.
Based on the MAPD data (Figure 2), which reflects approximately two-thirds of the Connecticut market, forbearance rates in Connecticut peaked in June 2020 at 12.3 percent and have steadily decreased. As of April 2021, forbearance rates have remained steady at 5.4 percent for the last several months with at least 13,000 mortgages either in forbearance or 30 days delinquent.
Figure 2: Delinquent and Forborne rate by Month
Source: Atlanta Fed calculations using Black Knight’s McDash Flash daily mortgage performance data (available with a two-day lag), U.S. Census Bureau 2017 FIPS Codes
The MAPD data also demonstrates that delinquencies (Figure 3) and forbearance rates (Figure 4) appear to be highest in communities that are largely urban and lower-income, although some rural communities also stand out as well. This suggests a statistical correlation between mortgage delinquency, race/ethnicity and income. Specifically, the rate of delinquency trends higher in zip codes with higher percentages of households of color (Figure 5) and in zip codes with higher percentages of low-income households (Figure 6).
Figure 3: Percent 30 days delinquent by zip code (April 2021)
Source: Atlanta Fed calculations using Black Knight’s McDash Flash daily mortgage performance data (available with a two-day lag), U.S. Census Bureau 2017 FIPS Codes
Figure 4: Percent of Loans in Forbearance by Zip Code (April 2021)
Source: Atlanta Fed calculations using Black Knight’s McDash Flash daily mortgage performance data (available with a two-day lag), U.S. Census Bureau 2017 FIPS Codes
Figure 5: Percent Delinquent by Percent Minority in Connecticut Zip Codes (April 2021)
Source: Atlanta Fed calculations using Black Knight’s McDash Flash daily mortgage performance data (available with a two-day lag), U.S. Census Bureau 2017 FIPS Codes & IPUMS NHGIS, University of Minnesota, www.nhgis.org.
Figure 6: Percent Delinquency by Percent Low Income in Connecticut Zip Codes (April 2021)
Source: Atlanta Fed calculations using Black Knight’s McDash Flash daily mortgage performance data (available with a two-day lag), U.S. Census Bureau 2017 FIPS Codes & U.S. Department of Housing and Urban Development: LMISD - All Block Groups; HUD ZIP-tract crosswalk 2015Q4.
Arriving at the exact number of households currently facing a housing hardship using available data is challenging. In previous economic downturns that had devastating impacts on the housing market, one way to monitor the scope and scale of the hardships felt by homeowners would have been to track foreclosures and evictions. Fortunately, the foreclosure and eviction moratoria effectively held foreclosures to historically low levels relative to prior economic crises. This needs assessment is hesitant to over rely on any one data source to understand the circumstances facing Connecticut homeowners. For example, while the MAPD dataset estimates there are roughly 13,000 Connecticut mortgages either 30-plus days delinquent or in forbearance, this dataset represents just two-thirds of the mortgage market and excludes certain loans, like those in more rural zip codes. And because the MAPD data does not filter by the income of the mortgage holders, it does not allow for clear analysis along income characteristics. Currently, Black Knight’s calculation from June 2021 that 4.9 percent of Connecticut homeowners with a mortgage are 30-plus days delinquent is the best measure available of the total number of households impacted by the pandemic.
The Homeowner Assistance Fund
Recognizing the pandemic’s direct impact on homeowners throughout the country, Congress enacted as a part of the American Rescue Plan Act (ARPA), the Homeowner Assistance Fund (HAF). The goal of the $9.9 billion fund is to prevent mortgage delinquencies, defaults, and foreclosures among eligible homeowners as a result of the COVID-19 pandemic. Under the HAF program, Connecticut has been allocated approximately $123 million to assist struggling homeowners with mortgage payments, mortgage reinstatement, property tax assistance, and more. Eligible homeowners include those who earn under 150 percent AMI, live in a 1-to-4 unit home that is their principal residence, and had a COVID-related hardship after January 21, 2020.
The Connecticut Homeowner Assistance Fund plan is currently under review by the U.S. Treasury Department and is expected to be available later this year. The full plan and program updates can be found at www.chfa.org/haf.
Again, estimating the exact number of homeowners at risk of foreclosure and who may be eligible for HAF is difficult. Data from the most recent American Community Survey (Table 1) estimates that there are roughly 380,000 homeowners with a mortgage in Connecticut who earn less than 150 percent of area median income (AMI) Applying the Black Knight delinquency rate of 4.9 percent to the total number of eligible homeowners at 150 percent of AMI yields a potential applicant pool of 18,620. In the absence of more comprehensive state-wide loan level data, this estimate provides a sense of the potential scale of eligible homeowners in need of the Homeowner Assistance Fund in Connecticut.
Table 1: Estimate of Income Eligible Homeowners
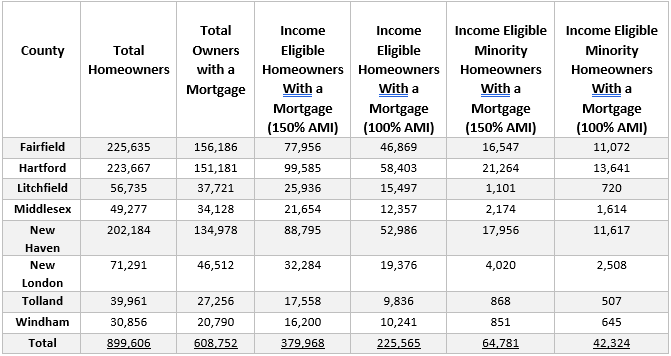
Source: 2015 – 2019 5-Year American Community Survey Estimates via IPUMS USA, University of Minnesota, www.ipums.org
To understand the nature of the potential outstanding mortgage debt, and in the absence of more comprehensive state-wide data, CHFA analyzed a sample of COVID-affected mortgage holders from one of its largest mortgage servicers (Table 2). Of the 860 sampled loans affected by COVID, 75 percent have been delinquent for more than 120 days. While the median unpaid balance for the overall sample was $11,440, the median amount for those 120 or more days delinquent was 30% higher at $14,943. While this is just a sample of loans it does give an indication of the financial hardship faced by certain homeowners as a result of the pandemic. And as the sample suggests, while the relative number of homeowners experiencing a hardship is yet to be determined, the nature of the hardship for those who are behind on their mortgage payments may be severe.
Table 2: COVID Affected Portfolio in Connecticut (February 2020 – August 2021)
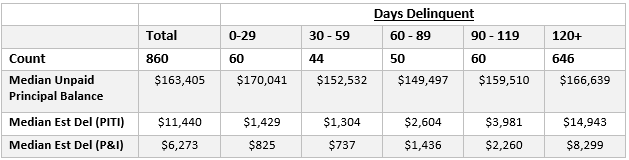
Source: Idaho Housing and Finance Association
To effectively target those most at risk of foreclosure, CHFA created the Homeowner Hardship Index (Figure 7). The index ranks zip codes on a range of socioeconomic and mortgage-related metrics (Table 3). Connecticut’s zip codes are ranked on each metric relative to their position amongst other zips codes and assigned a score between 1 and 235 (the total number of zip codes used in the sample), with a higher score indicating greater hardship. The scores are then summed across each metric to calculate a total risk score. Each metric is assigned an equal weight during the ranking. Zip codes with fewer than 50 active mortgages are excluded from the sample to better align it with Mortgage Analytics and Performance Dashboard (MAPD) data. The goal of the index is to incorporate current data to estimate the housing and economic distress and social disadvantage experienced at the level of each individual zip code. Indexing mortgage performance data with other socioeconomic metrics that are strongly associated with one’s ability to make mortgage payments (e.g., employment, income) will bring greater focus and targeting to marketing and outreach efforts to communities with, for example, higher rates of delinquency, large numbers of low and moderate households, and higher proportions of socially disadvantaged households as shown in Figures 5 and 6. This will ensure that Connecticut’s Homeowner Assistance Fund reaches the most at-risk homeowners in the state.
Table 3: Homeowner Hardship Index Indicators
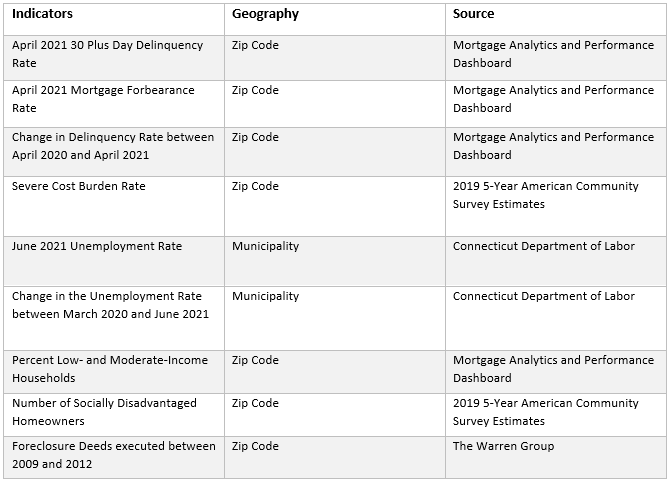
Figure 7: Homeowner Hardship Index
Conclusion
From the data and trends outlined in this analysis, it is clear that the COVID-19 pandemic has had a significant negative impact on homeowners in Connecticut. It is also clear that low-income communities and communities of color have borne the brunt of that impact. These neighborhoods have seen the highest prevalence of COVID cases and deaths, the steepest and most prolonged unemployment rates, and a sharp increase in mortgage delinquencies. The HAF program aims to prevent foreclosure and homelessness in these and other neighborhoods in Connecticut through mortgage reinstatement, monthly assistance, and more. CHFA will use the data outlined in this analysis as well as other data as it becomes available to measure the success of the HAF and to target marketing, outreach, and resources to those most at risk of losing their homes due to the economic fallout of the pandemic. By prioritizing outreach to areas with higher risk scores, as seen in the HHI, the CT HAF program will successfully target those distressed homeowners who are more likely to be people of color and of low- and moderate-income. These communities will continually be evaluated with more recent and relevant data as HAF is implemented.
A more detailed and interactive dashboard of the data presented in this analysis can be found here. A more complete Assessment of Homeowner Needs, as required by the U.S. Treasury HAF guidance, can be found on CHFA’s website along with a description of the full HAF program.
****
Andrew Bolger is a Legislative Program Officer in CHFA’s Government Relations Department where he assists in the Authority’s state and federal legislative and advocacy efforts. He received a BA in Economics and Political Science and an MA in Public Policy all from the University of Connecticut.