What 25 Years of Home Sales Data Can Tell Us
Dec 22, 2025
The latest edition of CT Housing Pulse takes a deep dive into 25 years of home sale data, specifically what it can tell us about sales volume, prices, and Connecticut’s housing stock. Check out previous Housing Pulse posts on homeownership and rental markets and the latest Census data.
For several years, CHFA has collected property sale records data from the Warren Group. In total the database now contains records of over 1.3 million sales between 2001 and mid-November 2025 at the time of this writing. The data generally includes what one may find on an assessor’s database. Unless otherwise stated, this analysis examines trends among 1–4 unit homes and condominium sales.
One to Four Unit Homes Sales and Median Sale Price
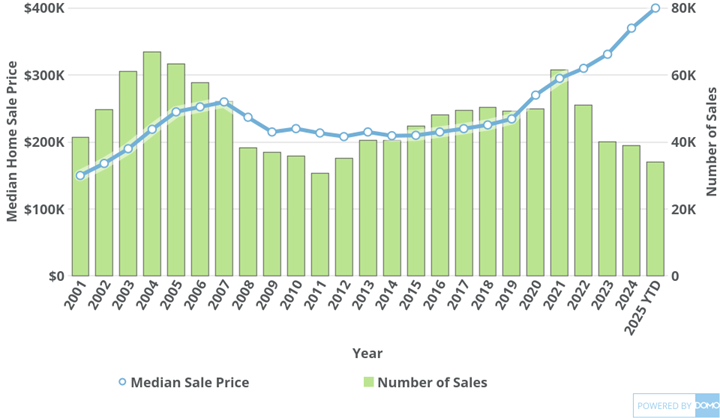
The number of home sales in Connecticut peaked in 2004 with over 67,000 one-to-four-unit homes sold. In the subsequent years with the onset of the Great Recession, the annual home sales volume declined significantly, bottoming out in 2011 with just 31,000 homes sold. In the years leading up to the COVID-19 pandemic, the state saw a gradual increase in overall sales volume, and in 2021 there were over 61,000 home sales recorded -- the highest since 2005. Between 2022 and 2025YTD, sales have been trending down as higher mortgage rates and limited inventory have significantly impacted housing affordability.
The median sale price followed a similar trend to sales volume, peaking in the mid-2000’s and then declining until 2011. Since then, the median sale price has increased dramatically, reaching an all-time high of $400,000 in 2025.
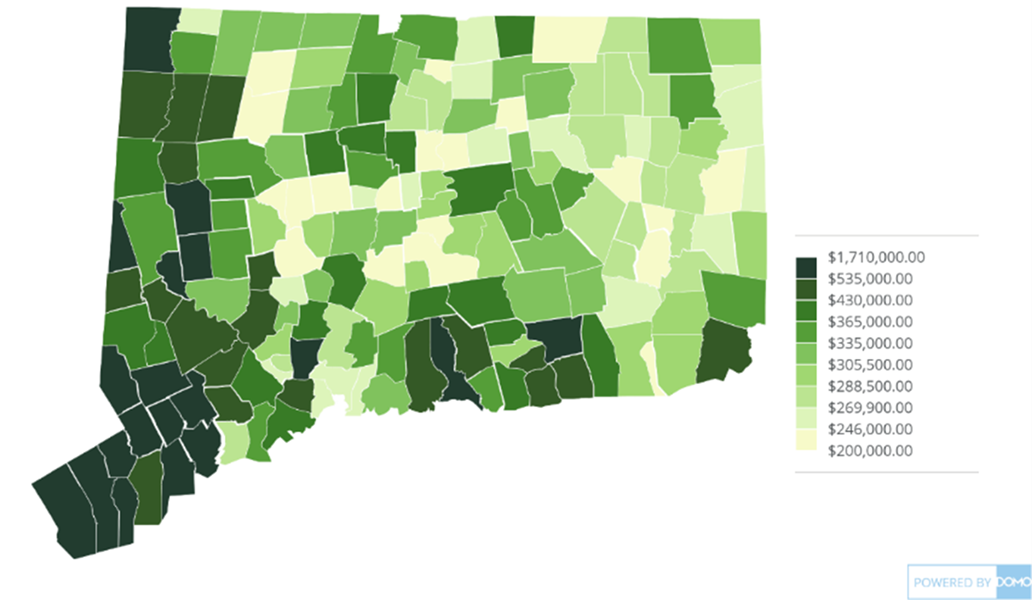
Median Sale Price by Town Since 2020
Median Sale Price per Square Foot by Town Since 2020
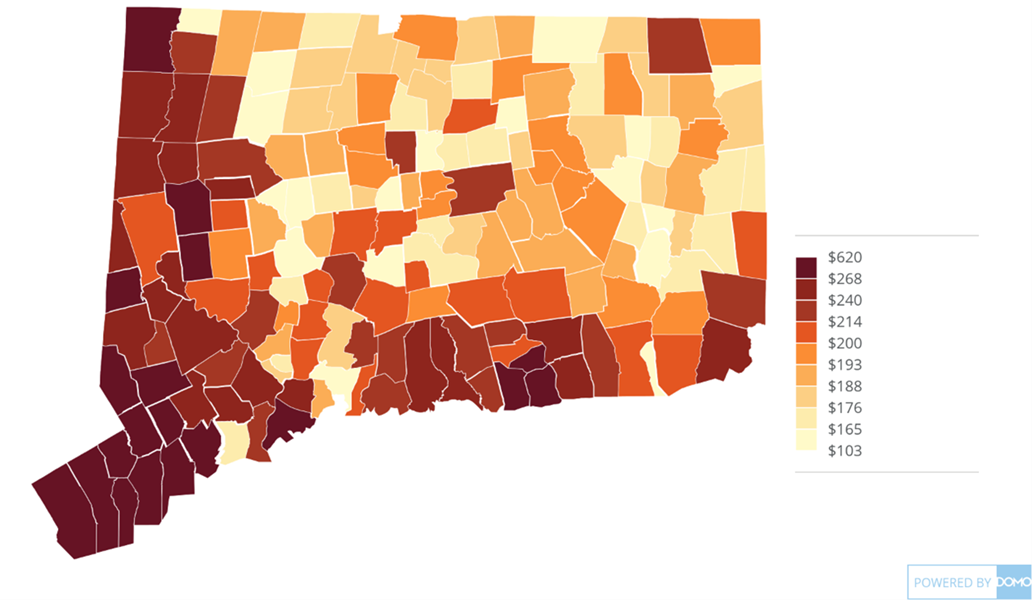
Home prices vary widely across the state. Generally, prices tend to be higher on the shoreline and in the western part of the state. Since 2020, Greenwich has had the highest median sale price at $1,710,000, and Norwich the lowest at $200,000. The same geographic trend applies to the median price per square foot. Also, in Greenwich since 2020, the median price per square foot was $620 while in Norwich it was $134.
Sales Price by Property Type and Year Built
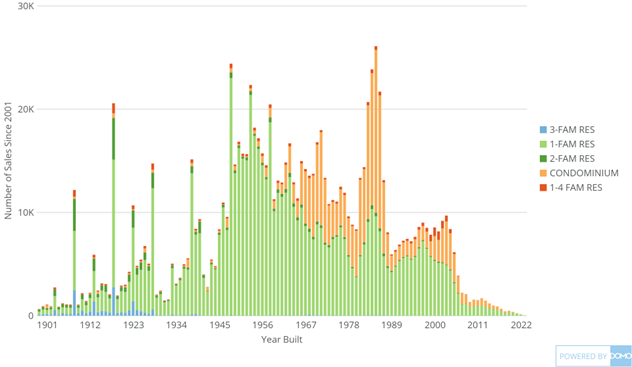
We can also plot this data by the year built and property type to get a snapshot of construction trends over the last century. As shown above, among 1-4 unit home sales since 2001, we can observe a trend where the vast majority of single-family residential properties were built in the middle of the 20th century. Additionally, we can see that the state underwent a condominium construction boom from the mid-1960’s up until the Great Recession, with a large spike in the late 1980’s. We can also see large single-year spikes at the decade and half-decade marks in the first half of the 20th century. These are likely properties where the exact year built is unknown, and the original assessor made an educated guess as to when the property was constructed also known as the “Effective Year Built”.
Average Internal Square Feet by Year Built
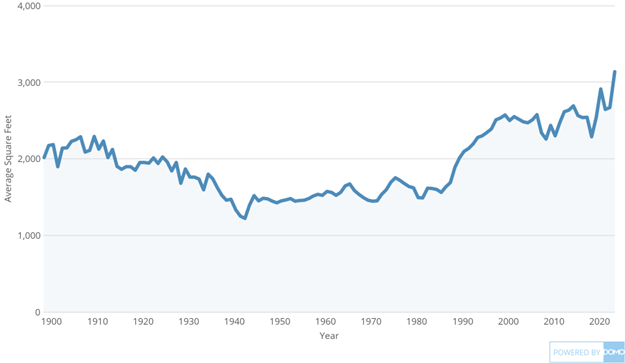
The average internal square footage has increased significantly since the post-World War Two period. Among sales of homes built between 1945 and 1990, their average size was 1,550 square feet, what one might consider a typical starter home. Beginning in the 1990’s, Connecticut began to see construction of much larger homes on average. Among sales of homes built after 2000, the average size was 2,550 square feet.
"Starter Single Family" Home Sales by Year Built
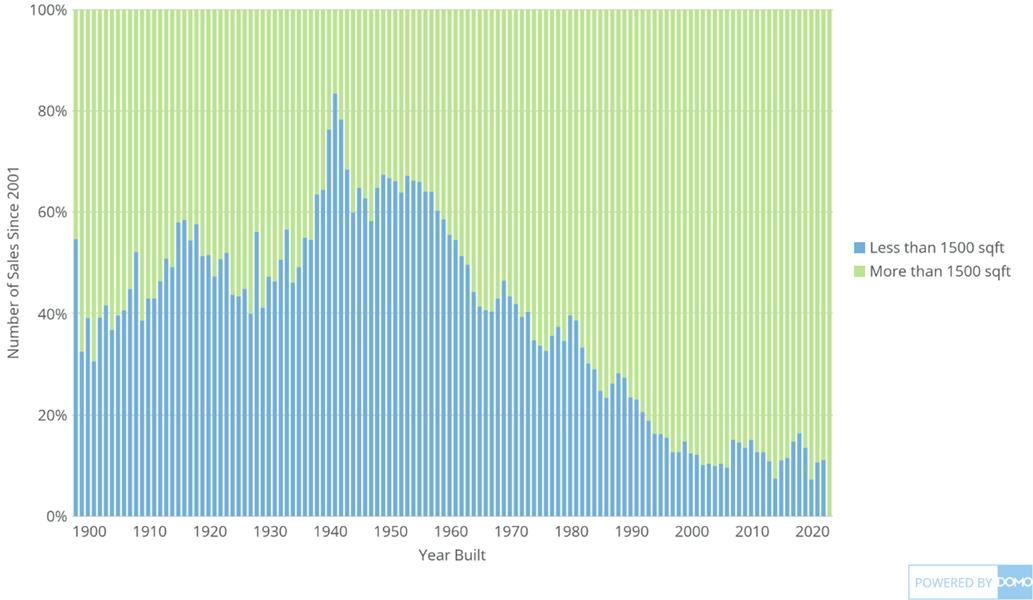
Another way to examine this trend is by looking at sales of just single-family homes above and below 1,500 square feet by the year they were built. Among sales of homes built between 1900 and 1970, 58% were below 1500 square feet. Between 1970 and 1990, that share was just 35%, and after 1990 it dropped to 16%.
Property Type by Year Built
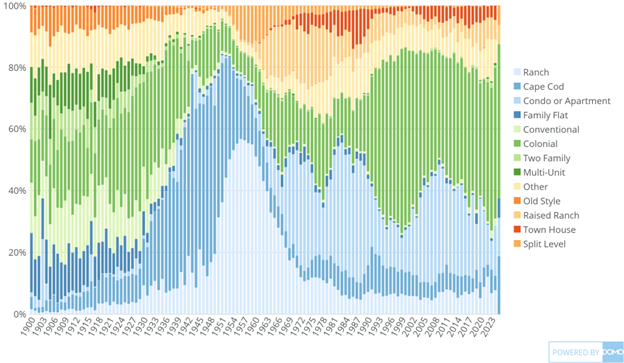
Lastly, this data can also reveal preferences in home style construction over the last century. We can see the surge in construction of Cape Cod and Ranch style homes in the 1930s to 1960s, the emergence of condominiums beginning in the 1970s, and finally the colonials beginning in the 1900s.
If you’d like to explore this data yourself, check out CHFA’s Regional and Municipal Housing Market Tracker.
Sign up to receive Intersect blog posts right in your Inbox!
------------------------------------------
Andrew Bolger is a Senior Research and Data Analyst in the Connecticut Housing Finance Authority’s Research, Marketing, and Outreach Department. In this role he manages CHFA’s housing database, tracks and analyzes housing market conditions, and evaluates CHFA programs. He received a BA in Economics and Political Science and an MA in Public Policy from the University of Connecticut.